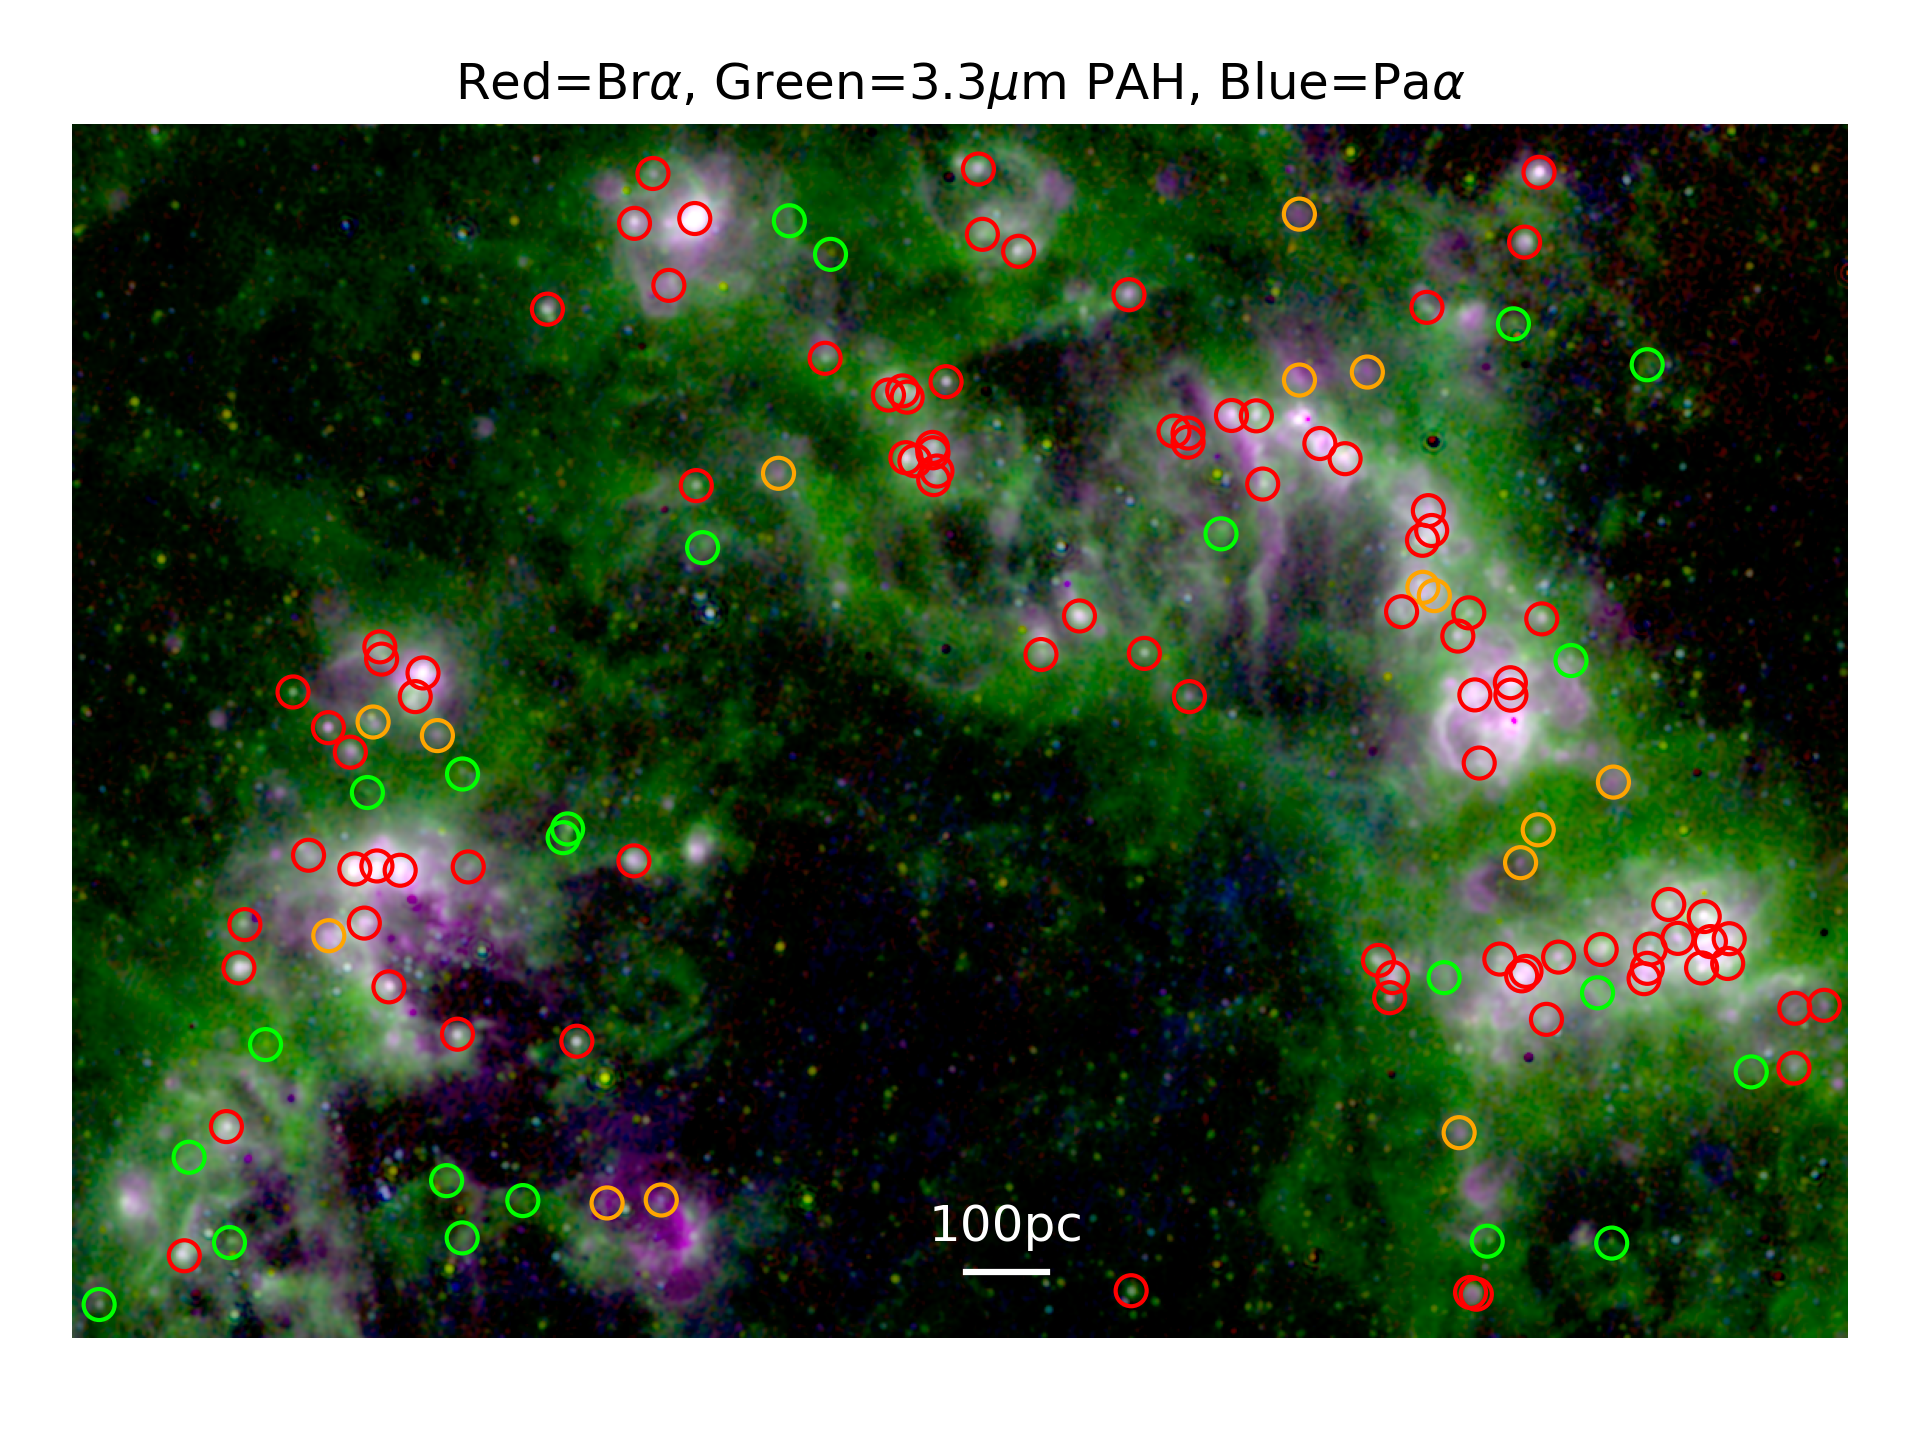
Image 1: JWST RGB image of ionized gas and PAH emission for a large star-forming region in NGC 628. The red circles show our eYSC-I sources, cospatial peaks in both ionized gas and PAH emission. For more details, see Gregg et al. (2024).
Ionized gas and dust emission around emerging young star clusters with JWST
My Ph.D. thesis is primarily focused on studying the ionized gas and dust emission around emerging young star clusters (eYSCs) using the incredible capabilities of the newly-launched James Webb Space Telescope (JWST). JWST offers an unprecedented view of nearby (< 10 Mpc) galaxies, mapping individual newly-formed, emerging star clusters and the surrounding interstellar medium (ISM) at a resolution that previously was only possible within the Milky Way and Local Group. Not only does this vastly increase our samples of young, massive star clusters and the HII regions that they ionize, but it allows for studies across diverse environments, e.g. low metallicity, intense bursts of star formation, etc. This is revolutionizing our understanding of the star formation processes that govern the evolution of galaxies across cosmic time.
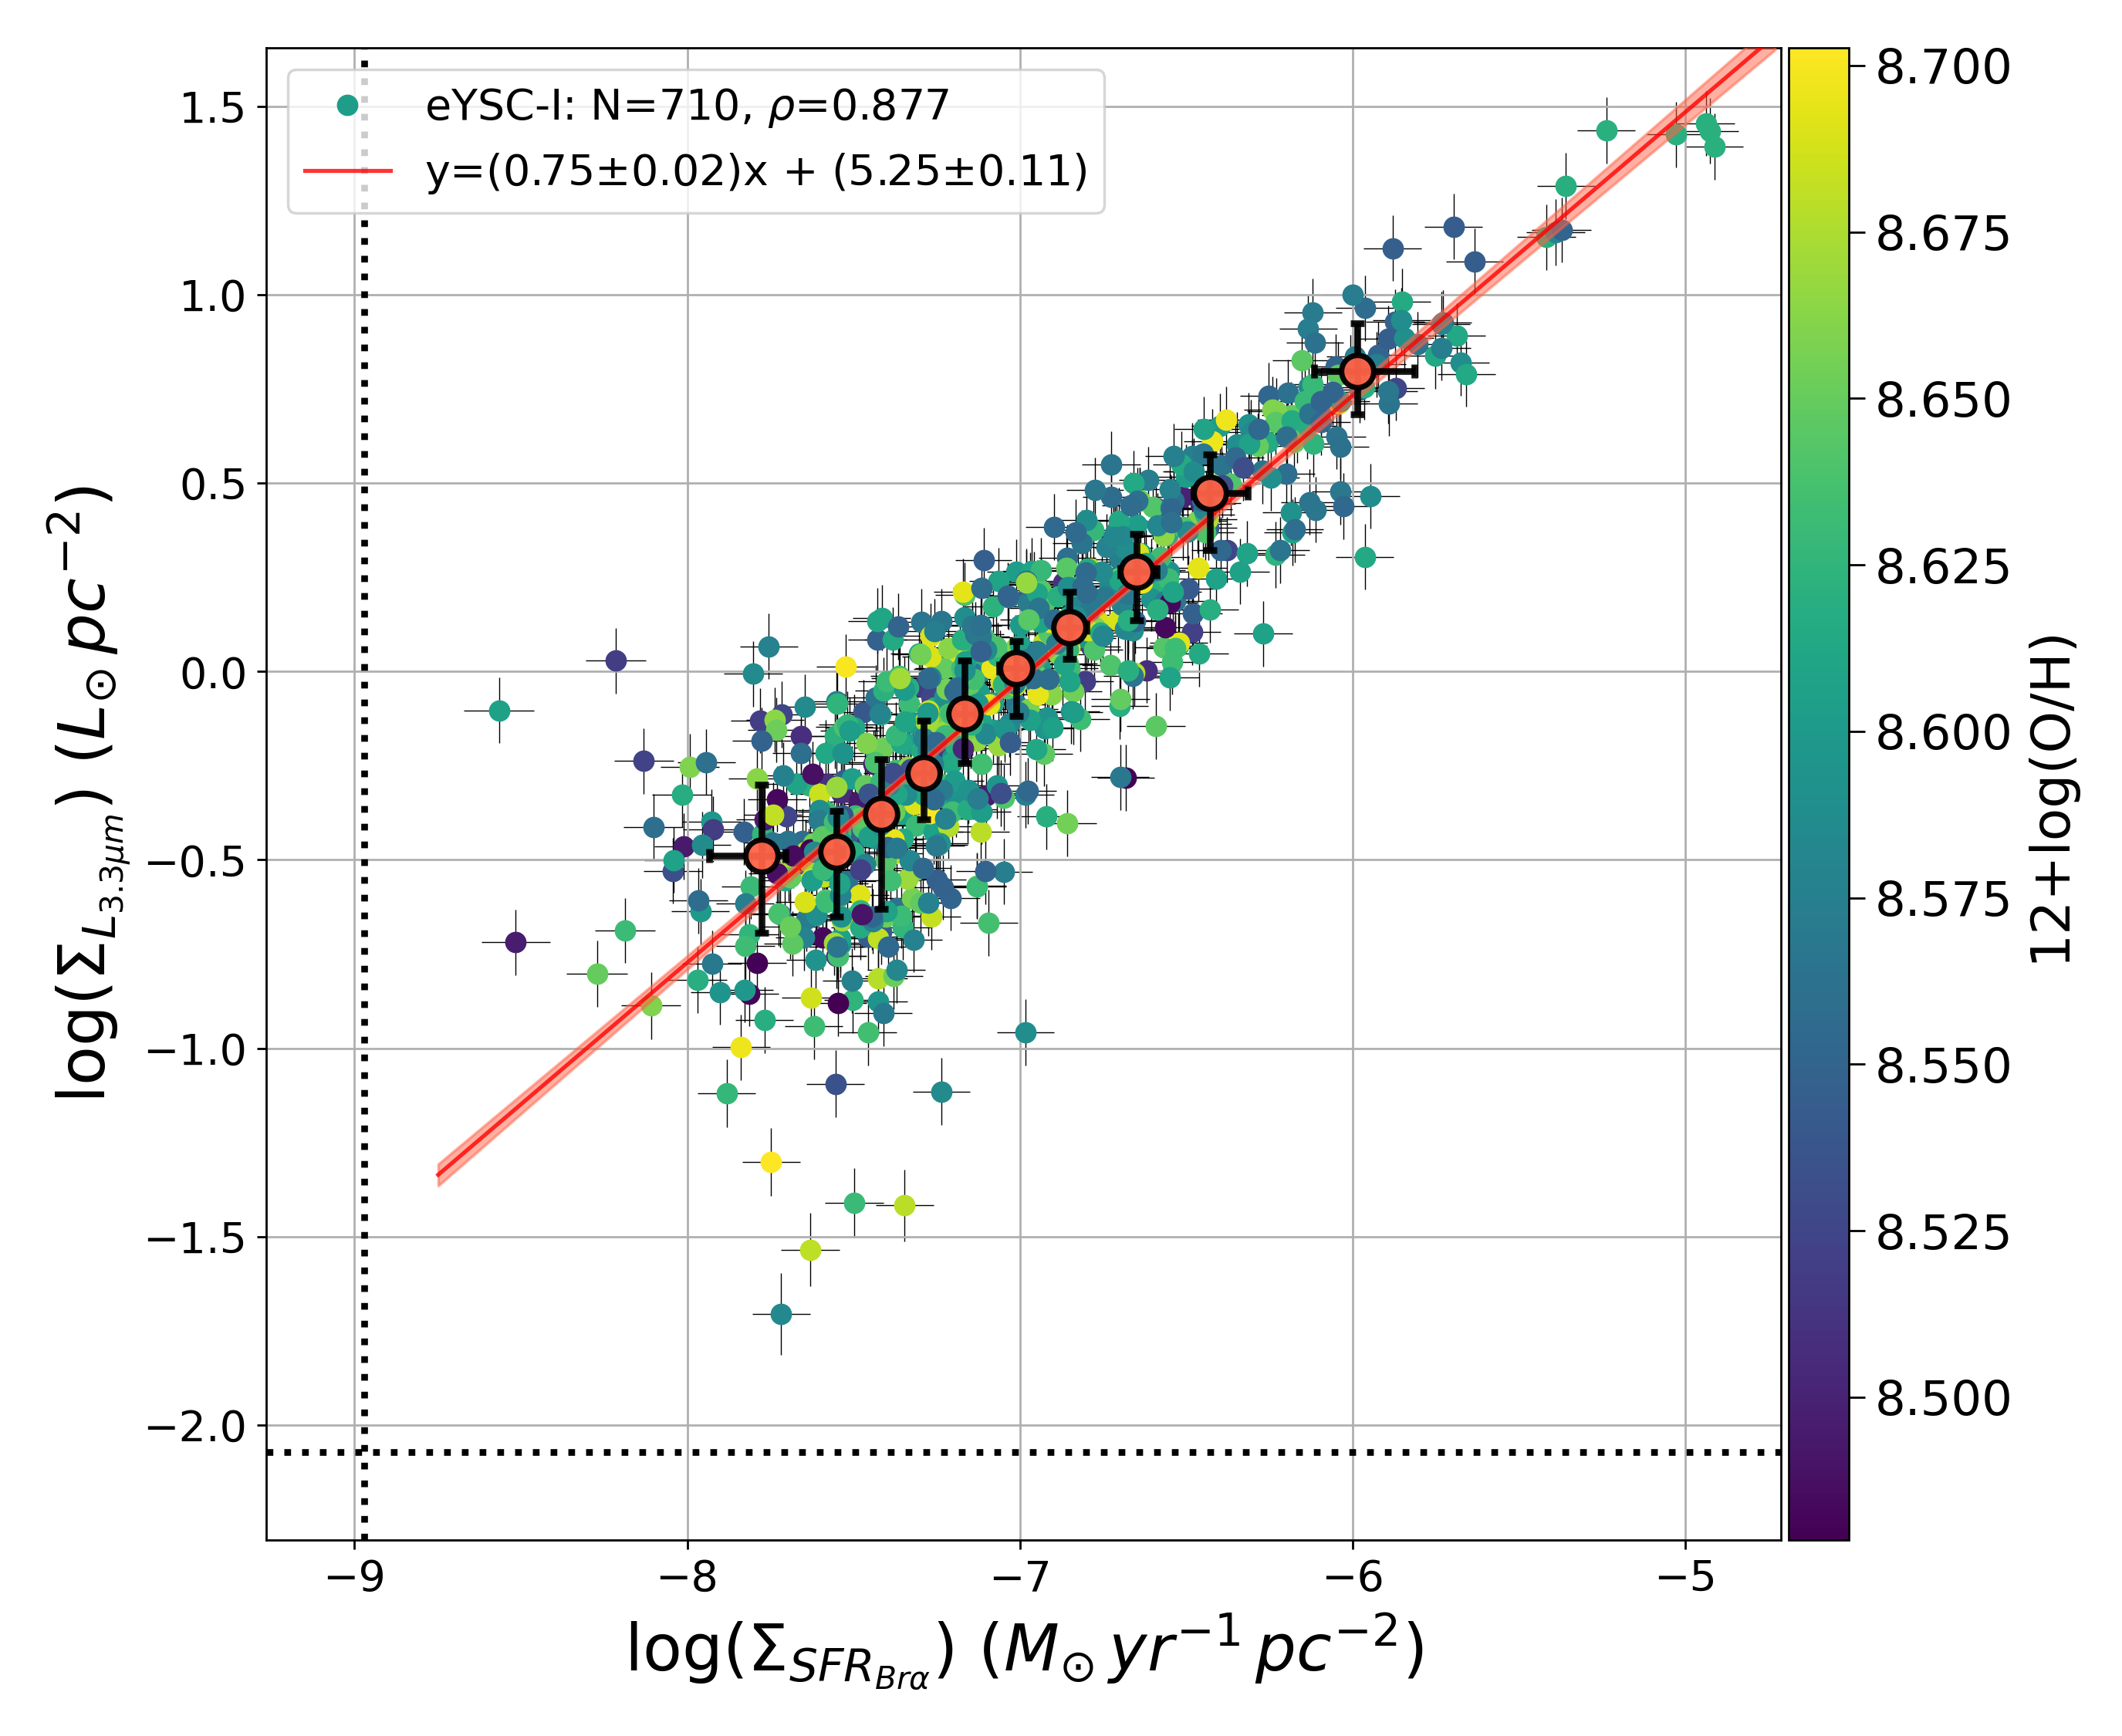
Image 2: Surface density of 3.3 micron PAH luminosity versus SFR for eYSC-I sources in NGC 628, where the points are color-coded by the oxygen abundance. The red line gives the best fit relation. See Gregg et al. (2024).
Specifically, I am interested in the excitation of small dust grains known as Polycyclic Aromatic Hydrocarbons (PAHs) in the photodissociation regions (PDRs) around newly-formed, massive stars. In particular, JWST now enables the mapping of the shortest wavelength PAH emission feature, 3.3 micron. This bright, near-infrared emission feature has potential important application to star formation studies of high redshift (very distant) systems. Given that the brightness of the 3.3 micron PAH feature traces the local strength of star formation, it may enable the derivation of obscured star formation rates (SFRs) in systems out to a redshift z ~ 5 with JWST/MIRI. This is crucial as standard mid-infrared tracers like the 8 micron PAH feature are observable with JWST only out to a redshift z ~ 2, however the majority of the cosmic SFR density remains obscured by dust and emerges in the infrared out to a redshift z ~ 5.
With JWST data obtained by the FEAST program along with archival HST data, I create maps of ionized gas (Hα, Paα, Brα) and PAH emission (3.3 and 7.7 micron) across six nearby galaxies. Catalogs of eYSCs are then constructed, extracted as peaks in both ionized gas and PAH emission (see Image 1). I then compare the PAH and ionized gas emission measured around our eYSCs to calibrate the 3.3 micron feature as a SFR tracer for the first time on resolved scales (see Image 2 and Gregg et al. (2024)). I find that the relation is significantly sub-linear, suggesting that other secondary processes likely contribute to the relation (e.g. PAH destruction towards high luminosity), complicating its use as a SFR tracer.
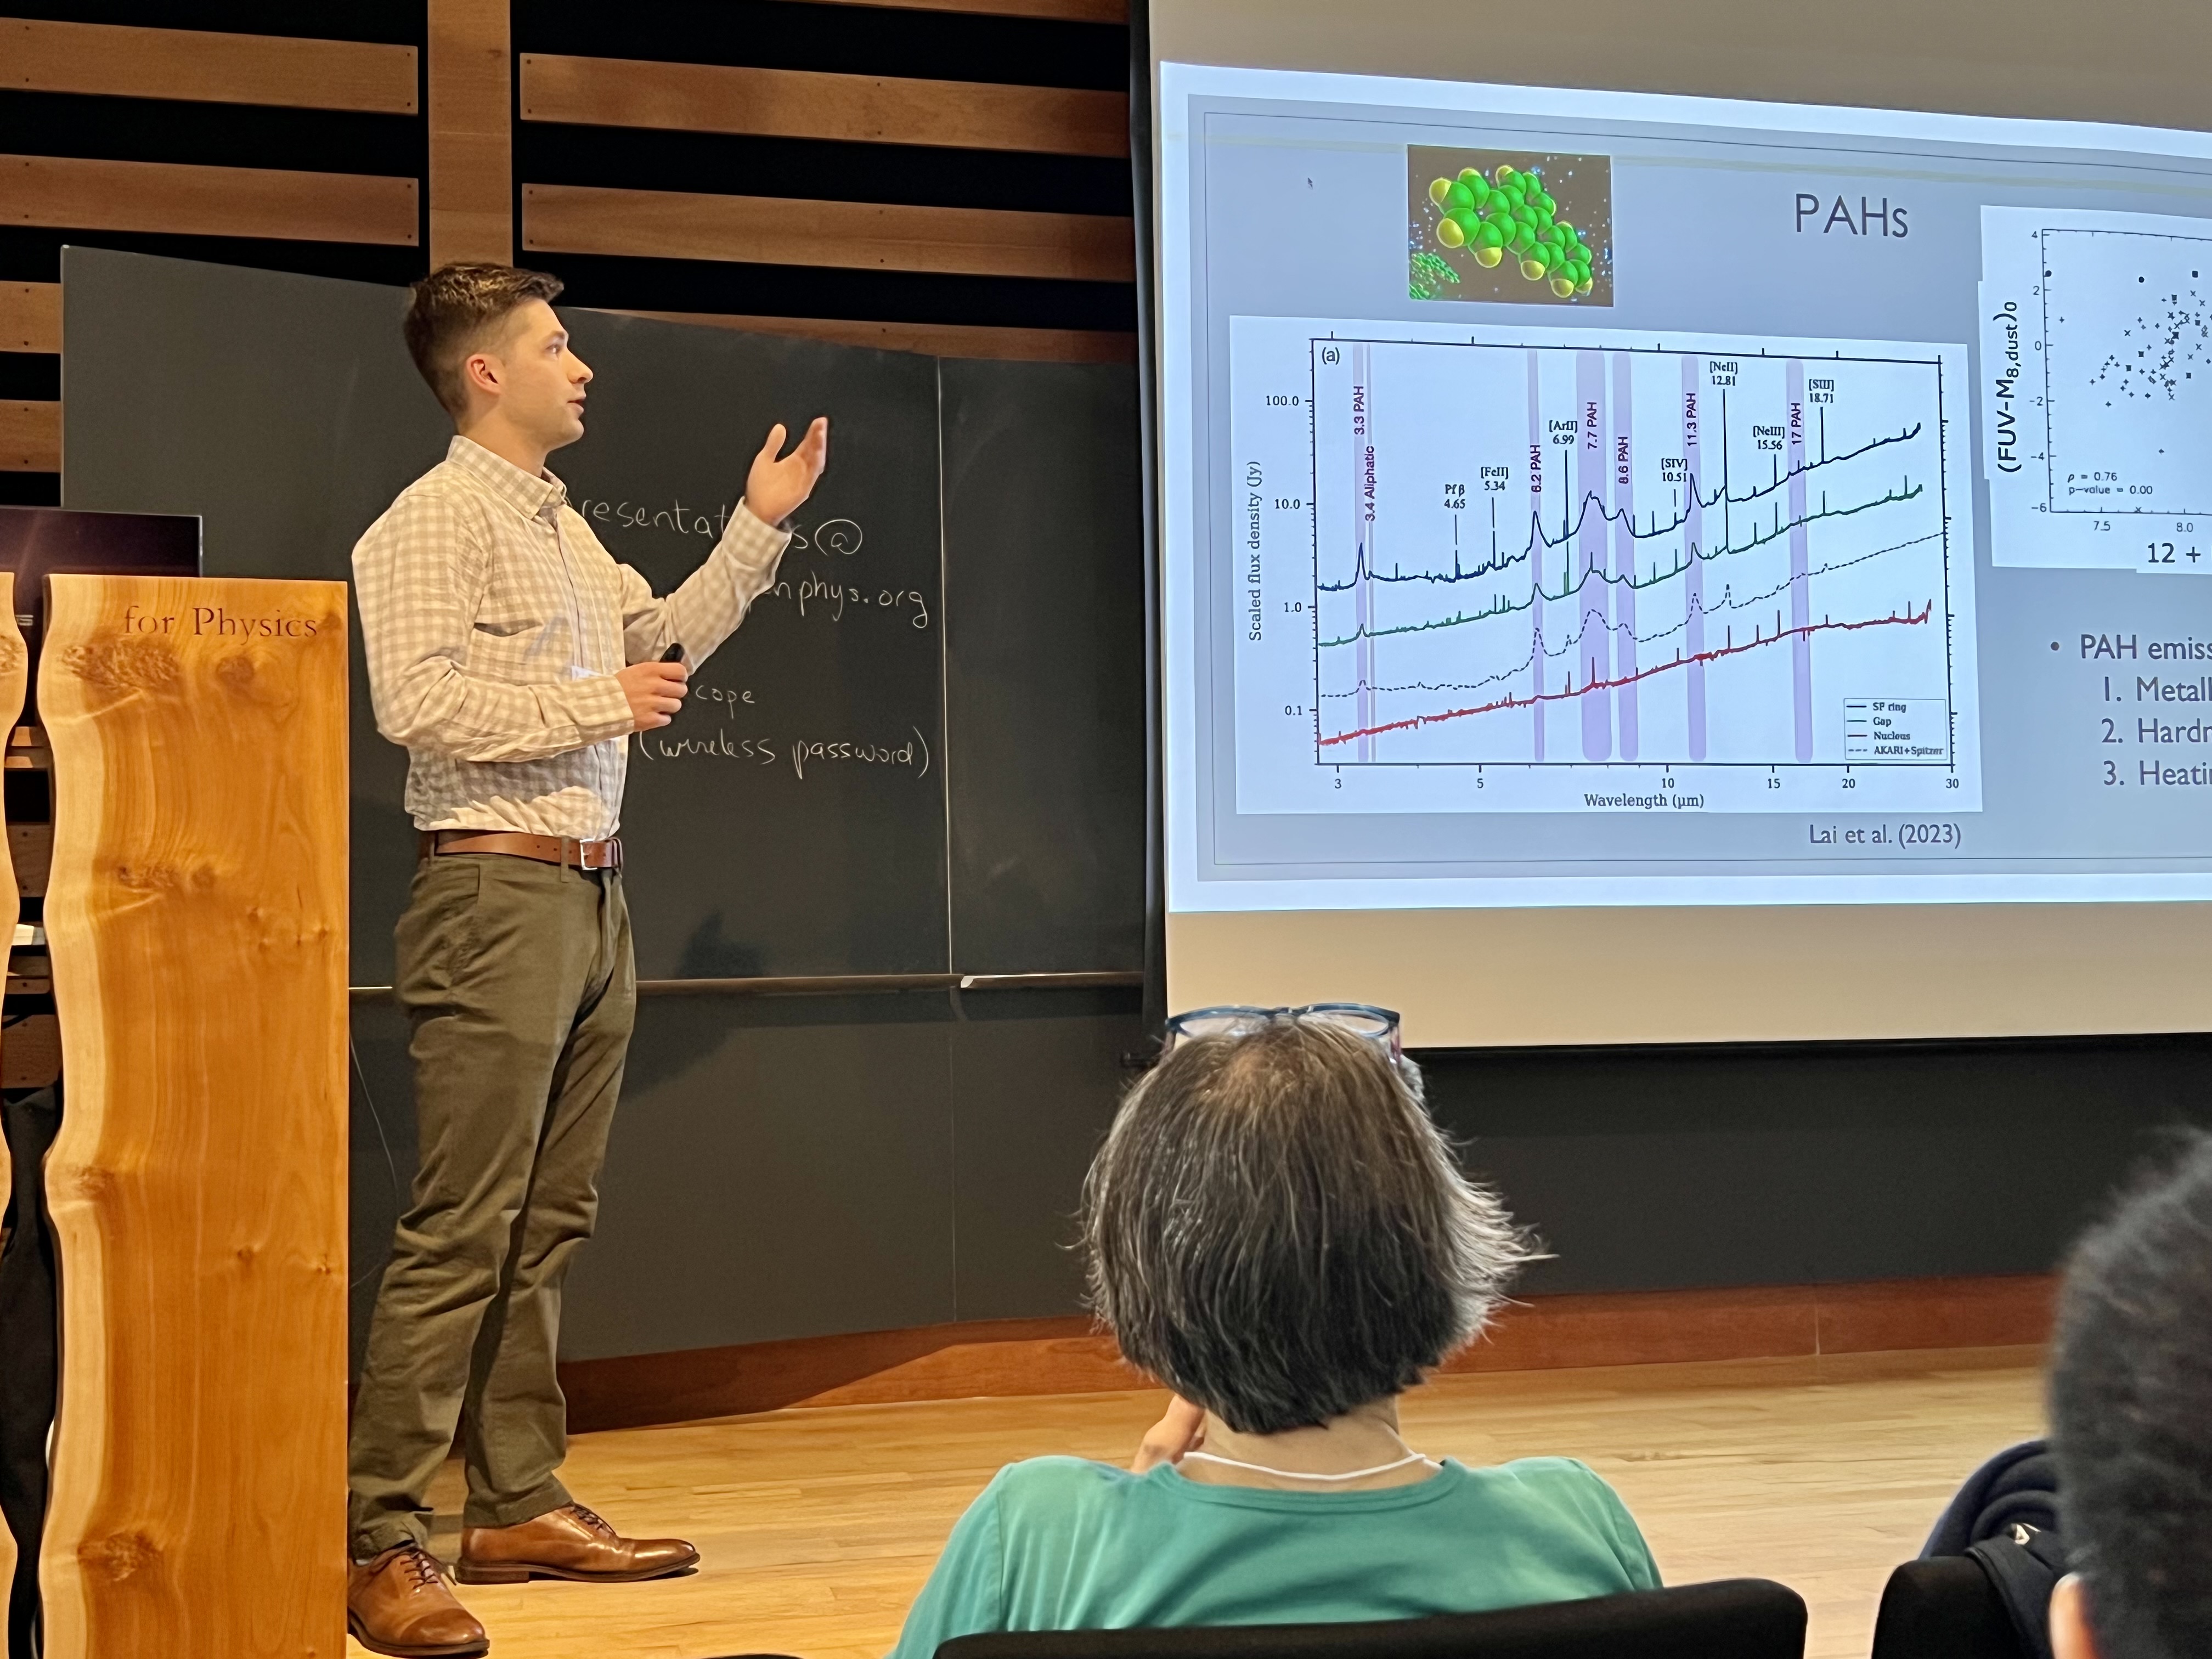
Image 3: Conference in Aspen, CO 2024, "The Physics and Impact of Astrophysical Dust".
Recently, I am focused on extending this analysis to other systems to determine the effect of varying ISM environment and also determining the impact of dust extinction, dust geometry, stochastic IMF sampling, etc. In addition, I am investigating the calibration of the 7.7 micron feature on these scales, as well as the PAH ratios as a function of ISM metallicity. Our team has also obtained Cycle 2 JWST/NIRSpec spectra of a sample of our eYSCs that will be used to help develop our understanding of this complex regime of the Spectral Energy Distribution (SED) in our sources. I am working on using these spectra to understand our methods of subtracting the continuum under the emission lines via the JWST/NIRCam filters so that we can provide recipes for future studies.
The infrared SED, stellar mass, molecular gas, dust continuum, and more

Image 4: Far-infrared versus mid-infrared color (or flux density ratio) for a sample of nearby galaxies identified as having a significant correlation on small scales (Regime 1). Points are color-coded by the oxygen abundance. See Gregg et al. (2022) for more details.
In Gregg et al. (2022), we investigate the relations between mid- and far-infrared colors in a large sample of nearby galaxies on about kiloparsec scales. The well-known tight connection between the star-forming properties of galaxies, typically derived in the mid-infrared, and the dust and gas content, derived in the far-infrared, has been found to break down for sub-kiloparec regions in galaxies as the dust and gas becomes decoupled from newly-formed stars. However, we find that some systems still exhibit strong relations between their mid- and far-infrared colors on small scales (see Image 4), while some do not. We find that this dichotomy is likely driven by two effects, the strength of star formation and the metal content of the ISM, that drive the observed mid-infrared colors, specifically the bands that trace PAH emission. Understanding these correlations in the infrared SED is essential in the modern era of Astronomy (facilities such as JWST and ALMA) for developing our knowledge of potential biases and correlations (trivial or physical) in the derived physical properties of galaxies.
I am interested in and have worked on a number of other things in the past, including deriving accurate stellar mass maps across nearby systems using the near-infrared and determining molecular gas content via CO emission and dust continuum with ALMA. I started my career in astronomy attempting to detect a multi-wavelength counterpart to Fast Radio Bursts. I am experienced with SED fitting codes like CIGALE and fitting galaxy structural features with GALFIT. I have worked with data from many different telescopes from the far-ultraviolet to radio wavelengths and am an expert in the analysis of multi-wavelength image data.